Description PRODUCT DESCRIPTION WHAT’S IN THE BOX SPECS InBody Automated Blood Pressure Monitor BPBIO 320S The BPBIO 320S is an accurate, fully automated, and easy-to-use blood pressure monitor. The monitor features a voice-guided, single -step measurement process and elbow sensor that helps you to be in the ideal position for…


InBody Automated Blood Pressure Monitor BPBIO 320S
-96% OffOriginal price was: $2,795.00.$99.00Current price is: $99.00.
Description
Description
- PRODUCT DESCRIPTION
- WHAT’S IN THE BOX
- SPECS
-
InBody Automated Blood Pressure Monitor BPBIO 320S
The BPBIO 320S is an accurate, fully automated, and easy-to-use blood pressure monitor. The monitor features a voice-guided, single -step measurement process and elbow sensor that helps you to be in the ideal position for testing.These technologies ensure that you follow proper testing protocols each time for accurate measures.
Features
45-Second Test : Receive comprehensive measurements in just 45 secondsCompact and Portable : Space-efficient design lets you set up the device wherever you need itVoice Guidance : Guides you through the measurement process for easy self-testingElbow Sensor : Allows you to be in the ideal position for accurate testingSample BPBIO 320S Result Sheets
Systolic Blood Pressure : The pressure of blood exerted on the artery walls when the heart beats. Maintaining systolic blood pressure below 120 mmHG has been shown to reduce the risk of diseases associated with hypertension, such as coronary heart disease, stroke, kidney failure, etc. Diastolic Blood Pressure : The pressure of blood exerted on the artery walls when the heart rests between beats. Maintaining diastolic blood pressure below 80 mmHG has been shown to reduce the risk of diseases associated with hypertension. Mean Arterial Pressure : The average pressure in the arteries during a single cardiac cycle. MAP has been shown to correlate with and indicate perfusion and effective delivery of nutrients to the various organs. Normal MAP range: 70 – 100 mmHG Pulse Pressure : The numeric difference between the systolic and diastolic blood pressure that has been shown to correlate with coronary heart health. Studies show that maintaining a pulse pressure between 40 and 60 mmHG is recommended for regulating good heart health. Pulse Rate : The number of heart beats per minute. A low resting heart rate has been shown to correlate with efficient heart function and cardiovascular fitness. Normal range: 60 – 100 BPM The product of systolic blood pressure and heart rate that has been shown to indicate myocardial oxygen demand.
-
- 1 Tabletop Monitor Stand
- 1 Adjustable Height Stool
- 1 Power Cable
- 1 Box Disposable Cuff Barriers (300ct)
- 1 Information Panel
- 2 Nylon Fabric Arm Cuff Cover
- 2 Paper Roll
- 1 User’s Manual
- 1 Year Manufacturer’s Warranty
-
Test Duration: 45 secondsMeasurement Method: OscillometricDisplay Unit: 1mmHgMeasurement Range: 0 – 300mmHg (Pressure) 30 – 240bpm (Pulse)Equipment Weight: 20 lbsProduct Dimensions: 17.7 x 19.3 x 11.2 ( L x W x H ) : inStand Dimensions: 15 x 18.1 x 32.3 ( L x W x H ) : inWarranty: 1 Year Manufacturer’s WarrantyDisplay Type: 7-Segment LED (Systolic, Diastolic, Time, Pulse)Voice Guidance: Guide users through blood pressure measurements and resultsPower Source: AC 100 – 240V, 50/60HzPrinter: High-speed thermal printerAccuracy: ± 2mmHG (Pressure), ± 1.5% (Pulse)Cuff Size: Arm circumference: 7 – 16 inchesPressurization Time: Approximately 10 secondsDatabase: Stores results for the last 5 measurements OutputsSystolic Blood Pressure, Diastolic Blood Pressure, Mean Arterial Pressure, Pulse Pressure, Pulse, Rate Pressure ProductDual Safety System [START/STOP] button: If the air pressure exceeds 300mmHg, the cuff will automatically deflate. [EMERGENCY] button: The cuff will quickly deflate regardless of the pressure. Type of Result Sheets 3-line high-speed printing or graph printing 6-line high-speed printing or graph printing Last 5 measurements printing
Related products
-
 -30% Off
Original price was: $37.00.$25.90Current price is: $25.90.
-30% Off
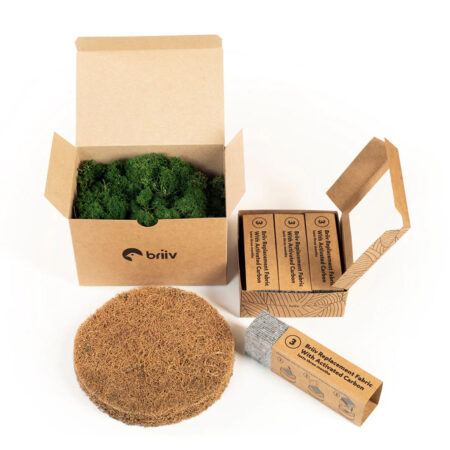
Original price was: $37.00.$25.90Current price is: $25.90.Description With this complete Filter Set, your Briiv will filter the air in your environment, creating clean, safe air so you can breathe as nature intended. Moss – The first filter is naturally grown, ethically harvested reindeer moss. This layer will remove PM10 sized particles like pollen and other allergens such as pet…
-
 -86% Off
Original price was: $649.99.$94.00Current price is: $94.00.
-86% Off
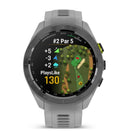
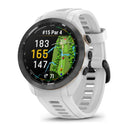
Original price was: $649.99.$94.00Current price is: $94.00.Description Garmin Approach S70 Premium Golf Smartwatch A whole-in-one premium GPS golf watch, the Approach S70 from Garmin, a stylish wrist-wear to keep you fit both on and off the course. Featuring a super bright 1.4″ Amoled touchscreen display with 43000+ preloaded courses from across the world, Garmin’s Approach S70 gives your game…
-
 -81% Off
Original price was: $499.00.$94.00Current price is: $94.00.
-81% Off
Original price was: $499.00.$94.00Current price is: $94.00.Description PRODUCT DESCRIPTION WHAT’S IN THE BOX SPECS Coway Airmega 300S HEPA Air Purifier- Wifi Model The new Coway Airmega 300 Smart air purifier is a perfect device to find relief from allergy or asthma symptoms. Airmega 300 comes with a wifi connectivity and dual stage filtration system which helps…
-
 -86% Off
Original price was: $649.99.$94.00Current price is: $94.00.
-86% Off
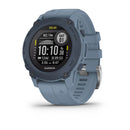
Original price was: $649.99.$94.00Current price is: $94.00.Description Garmin Descent G1 Solar Dive Computer and Smartwatch A rugged smartwatch aimed at divers, the Descent G1 Solar is an intuitive, watch-sized dive computer, with trim and slim built. With a manageable screen size of 45 mm and made up of more impact-resistant fiber reinforced polymer, the Descent G1…